Weekly market wrap


What Do Markets Do After Elections?
Key Takeaways
- Stocks hit new record highs again last week, riding the wave of optimism that has come from the U.S. Fed's recent rate cut, ongoing AI enthusiasm, and signs of broadening leadership underneath the surface of the bull market.
- Markets have not yet seen any meaningful reactions from U.S. presidential election uncertainties. We suspect they may emerge as November approaches and a focus on policy proposals (and differences) intensifies. Volatility typically rises ahead of U.S. election day but often subsides quickly, as investors turn their attention back to the prevailing economic and market trends, which we'd posit won't shift dramatically based simply on the White House's new tenant.
- The larger takeaway for investors is that markets have performed well under both U.S. political parties, a condition that we don't think is under threat this time around. In particular, we suspect a divided Congress will limit the potential for any extreme policy implementations, allowing the markets to take their cues from what we expect will be an extended economic expansion and ongoing cycle of rising corporate earnings – factors that throughout history have principally governed market performance.
Markets have performed well in the lead up to this year's presidential election. Stocks were higher again last week, with the S&P 500 notching the sixth weekly gain in the last seven, with an impressive gain of 11% just since early August. Meanwhile, the TSX has gained more than 9% during that time, reaching all-time highs last week.
This is not necessarily an indication that the financial markets are ambivalent to the U.S. political uncertainties that are brewing, but instead we think this is indicative of a market that has been more keenly focused on Fed policy, which is an area where we have received a bit more clarity of late.
As we move past election day and the dust begins to settle on the headline and partisan reactions to the Oval Office's newest occupant, we think the market's focus will turn (return) to the following fundamental backdrop:
- An economy that, while shifting to a lower gear, is poised to advance at a decent speed (or put more simply, is not headed for the recession ditch).
- Central banks (the Bank of Canada and U.S. Federal Reserve) that, after two and a half years of stepping on the brake, are now easing policy.
- Corporate earnings that are accelerating, helping validate rising valuations and stock prices, as well as pave the path for the further broadening of this bull market.
This is good news, because history teaches us time and again that U.S. presidents don't govern longer-term market performance, fundamentals do. So, as we advance toward, and beyond, November 5, here are two takeaways based on what markets have historically done after elections:
1. We doubt we'll fully avoid some form of election-driven market volatility, but it will pass.
- This election poses uncertainty, and markets hate uncertainty. However, that election volatility is more reflective of the market repricing potential new policy proposals, instead of an implication that the election outcome represents a win-or-lose scenario.
- Historically, market volatility has risen leading up to elections and has subsided after. We think this demonstrates that once election uncertainties are replaced by a clearer policy outlook (regardless of which political party will be setting those policies), the market typically refocuses back on the prevailing conditions. The potential for a divided U.S. Congress limits the likelihood that any extreme policies from either Harris or Trump would be implemented. We suspect this is, in part, why markets have not overreacted to campaign proposals to this point.
- Given the tight race, this does raise the question around the possibility of a contested election result. Again, we doubt this presents a longer-term influence for financial markets, but it would likely extend market volatility further than normal. Using the 2000 election (hanging chad) as a guide, volatility remained elevated and stocks fell 4%* until the Supreme Court ruled on the outcome in mid-December, after which market volatility (measured by the CBOE Volatility index) declined materially as election uncertainty cleared. Since World War II, volatility has decreased by an average of 16% in the month following presidential elections. Most recently, the VIX index (a measure of stock-market volatility) declined 36% in the 10 days following 2020´s Trump-Biden election.
Election-driven volatility tends to subside quickly after election day.
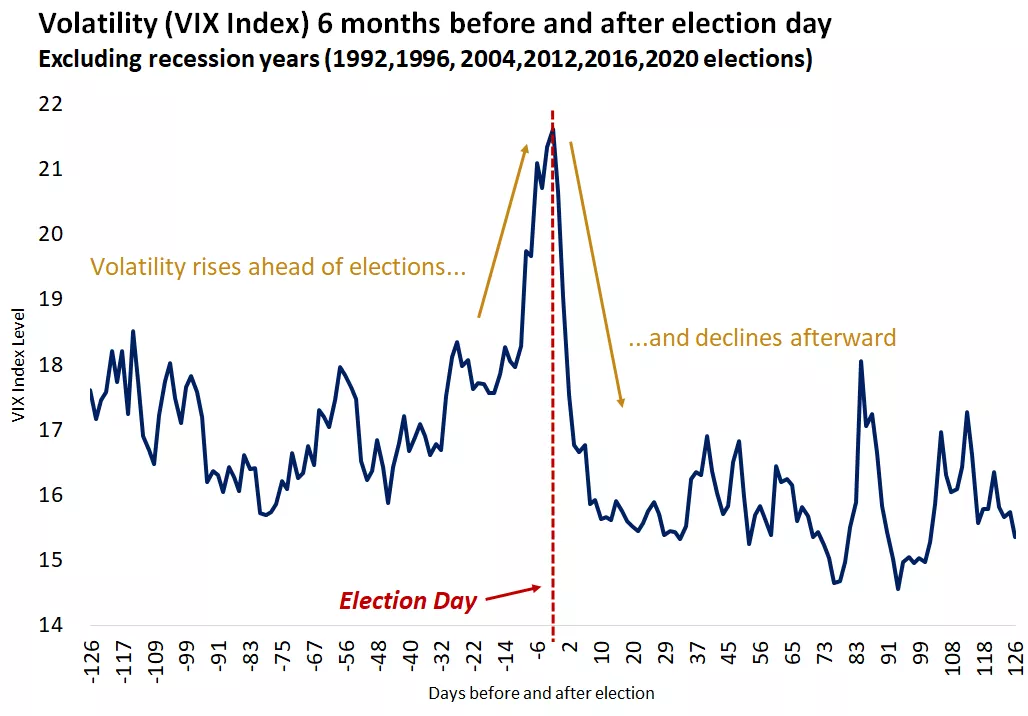
This chart shows the level of the VIX Index six months before and after election day. Historically, volatility has spiked in the weeks leading up to the election and declined after. Past performance does not guarantee future results.
This chart shows the level of the VIX Index six months before and after election day. Historically, volatility has spiked in the weeks leading up to the election and declined after. Past performance does not guarantee future results.
2. Markets have generally done well after elections, so stick around.
- Over the past 80 years, in the one month leading up to U.S. presidential elections, the stock market was positive for that month in only slightly more than half the years. However, from the election through year-end, the market was positive during that period in all but three years. It's worth pointing out that the largest post-election (through year-end) gains occurred in (in descending order): ´20, '52, '60, '04, '80, '72, '16, '96, '76, '92. This is composed of five Republican wins and five Democrat wins, reflecting the fact that markets have taken their direction more consistently from broader fundamental conditions than from political parties.
For perspective, here's a look backward at what happened after presidential elections since WWII*:
1 Week Later:- The stock market dropped an average of -1% in the week following the election.
- The worst 1-week performance followed the 1948 (-6%) and 2008 (-15%) elections; the best followed election day in 2020 (5%), 2004 (3%) and 1996 (2%).
- More than 60% of the time, the stock market was down in the week following the election.
1 Month Later:- The stock market increased by an average of less than 1% in the month following the election.
- The worst 1-month performance followed the 1984 (-4%) and 2008 (-16%) elections; the best followed election day in 2020 (9%), 2004 (6%) and 2016 (5%).
- The tables are flipped versus the 1-week figures, with the market positive more than 60% of the time in the following month.
1 Year Later:- The stock market rose an average of more than 10% one year from the election.
- The worst 1-year performance followed the 2000 (-21%) and 1956 (-10%) elections; the best followed election day in 2020 (40%), 1996 (35%) and 1960 (32%).
- Stocks were positive nearly 70% of the time in the year following elections, with performance over this wider period reflecting more factors than just election responses.
1 Presidential Term Later:- The stock market has an average gain of 61% during the four-year term periods.
- The worst performance followed the 2004 (-19%) and 2000 (-2%) elections; the best followed 1948 (134%) and 1952 (131%).
- The two worst periods above were the only two terms that experienced a decline. Broad economic trends and market events, not election outcomes, were the primary determinant over these timeframes. Timing and external factors did play a role in the negative periods (tech bubble and housing market crashes, 9/11) while the post-war economic boom of the 1950s shaped the outsized gains in those periods.
Stocks have delivered solid returns under both parties; economic and financial conditions set the pace.
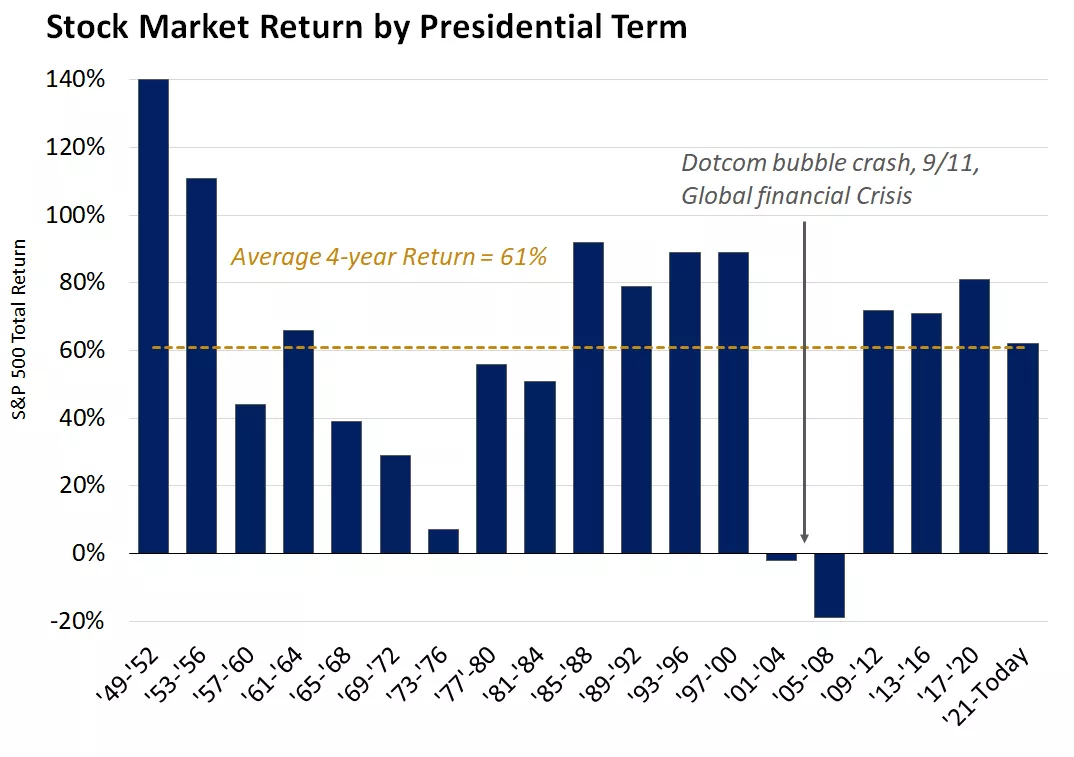
This chart shows the performance of the S&P 500 by presidential terms. Past performance does not guarantee future results. An index is unmanaged and cannot be invested into directly and is not meant to depict an actual investment.
This chart shows the performance of the S&P 500 by presidential terms. Past performance does not guarantee future results. An index is unmanaged and cannot be invested into directly and is not meant to depict an actual investment.
Craig Fehr, CFA
Investment Strategy
*Source: Bloomberg, Edward Jones. All market performance data based on the total return of the S&P 500 index.
Weekly market stats
| INDEX | CLOSE | WEEK | YTD |
|---|---|---|---|
| TSX | 23,957 | 0.4% | 14.3% |
| S&P 500 Index | 5,738 | 0.6% | 20.3% |
| MSCI EAFE * | 2,480 | 2.5% | 10.9% |
| Canada Investment Grade Bonds * | -0.4% | 3.5% | |
| 10-yr GoC Yield | 2.95% | 0.0% | -0.1% |
| Oil ($/bbl) | $68.54 | -3.5% | -4.3% |
| Canadian/USD Exchange | $0.74 | 0.7% | -2.2% |
Source: FactSet, 9/27/2024. Bonds represented by the Bloomberg Canada Aggregate Bond Index. Past performance does not guarantee future results. *4-day performance ending on Thursday.
The Week Ahead
Important economic releases this week include the U.S. ISM manufacturing PMI and U.S. nonfarm payrolls report.
Craig Fehr
Craig Fehr is a principal and the leader of investment strategy for Edward Jones. Craig is responsible for analyzing and interpreting economic trends and market conditions, along with constructing investment strategies and asset allocation guidance designed to help investors reach their financial goals.
He has been featured in Barron’s, The Wall Street Journal, the Financial Times, SmartMoney magazine, MarketWatch, the Financial Post, Yahoo! Finance, Bloomberg News, Reuters, CNBC and Investment Executive TV.
Craig holds a master's degree in finance from Harvard University, an MBA with an emphasis in economics from Saint Louis University and a graduate certificate in economics from Harvard.
Important information :
The Weekly Market Update is published every Friday, after market close.
This is for informational purposes only and should not be interpreted as specific investment advice. Investors should make investment decisions based on their unique investment objectives and financial situation. While the information is believed to be accurate, it is not guaranteed and is subject to change without notice.
Investors should understand the risks involved of owning investments, including interest rate risk, credit risk and market risk. The value of investments fluctuates and investors can lose some or all of their principal.
Past performance does not guarantee future results.
Market indexes are unmanaged and cannot be invested into directly and are not meant to depict an actual investment.
Diversification does not guarantee a profit or protect against loss.
Systematic investing does not guarantee a profit or protect against loss. Investors should consider their willingness to keep investing when share prices are declining.
Dividends may be increased, decreased or eliminated at any time without notice.
Special risks are inherent to international investing, including those related to currency fluctuations and foreign political and economic events.
Before investing in bonds, you should understand the risks involved, including credit risk and market risk. Bond investments are also subject to interest rate risk such that when interest rates rise, the prices of bonds can decrease, and the investor can lose principal value if the investment is sold prior to maturity.